How to Configure an OPNsense Dashboard
Overview
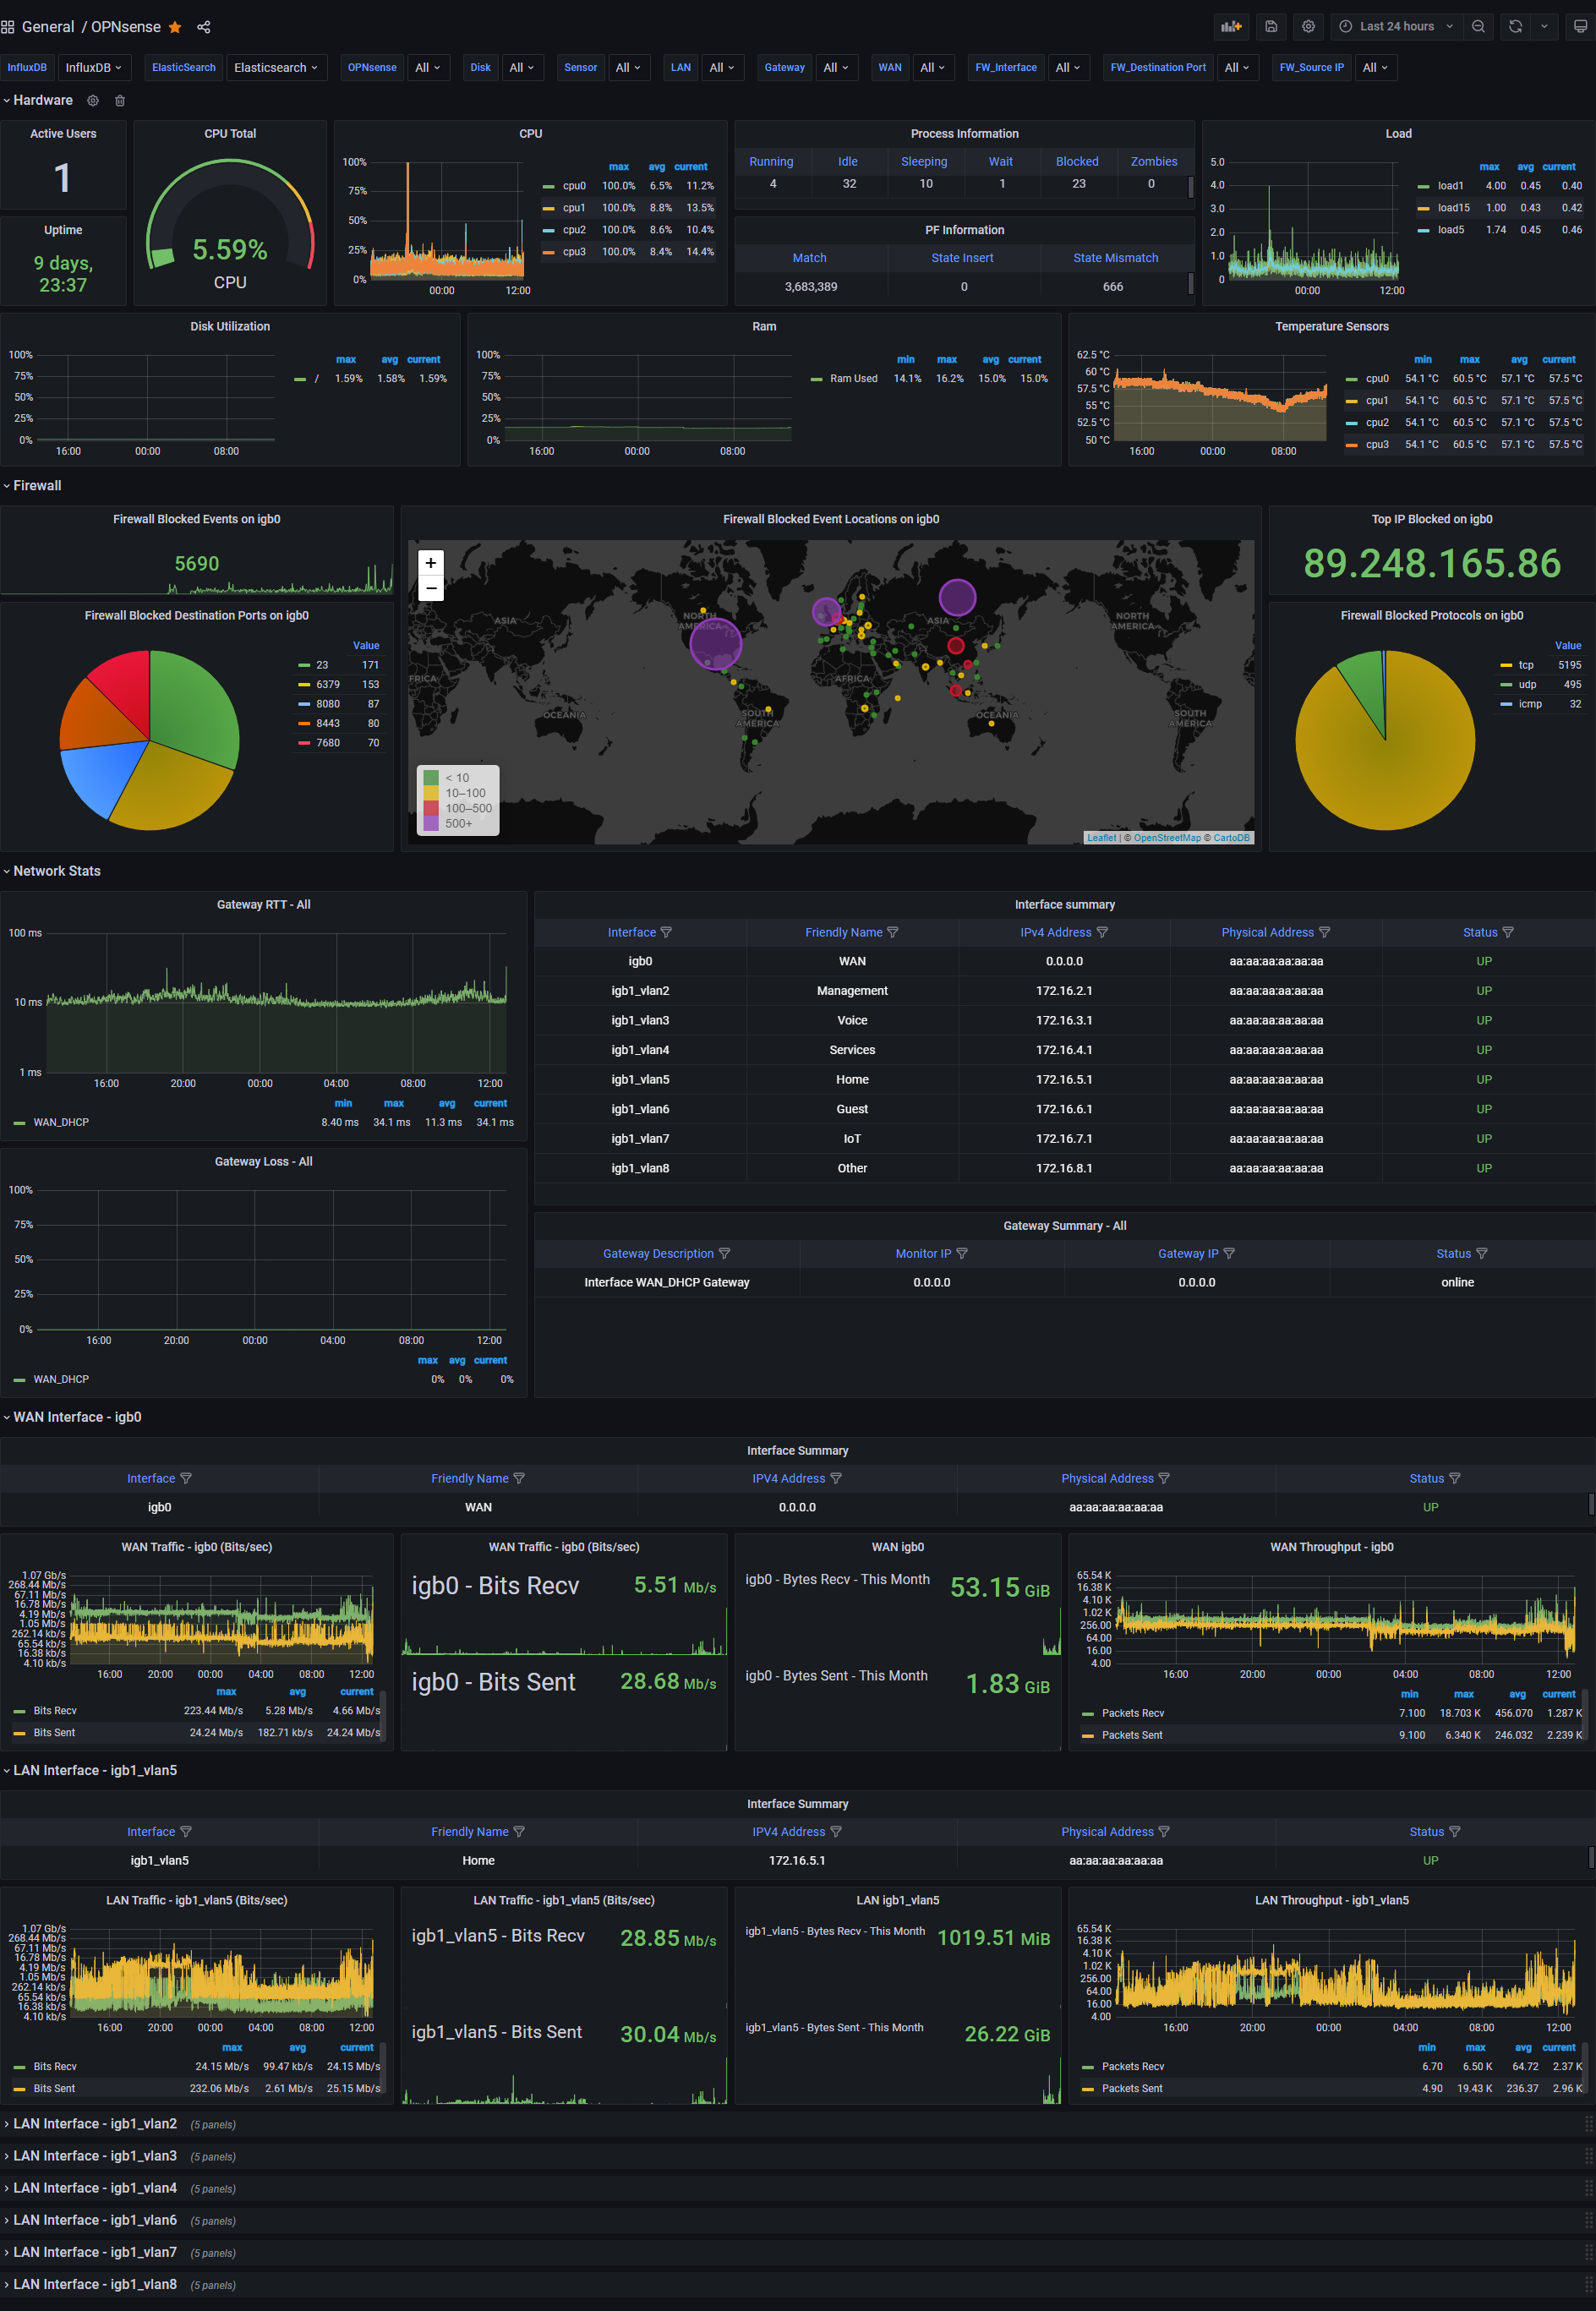
Want to have an awesome dashboard for your OPNsense firewall?
Follow along to set one up!
Docker
To simplify everything, we'll use a Docker Compose file.
You will need to have Docker and Docker Compose installed on a server that will host the dashboard.
After you've installed Docker and Docker Compose, download the docker-compose.yaml from this repo.
curl https://raw.githubusercontent.com/bsmithio/OPNsense-Dashboard/master/docker-compose.yaml -o docker-compose.yaml
It's important that you change the TZ environment variable to your timezone for everything to work properly.
I also recommend you change the passwords in this compose file as well.
After you've made the necessary changes, run docker-compose up -d in the same directory as your docker-compose.yaml.
Once you have your docker containers running, follow the steps below.
Configuring InfluxDB
After InfluxDB is started, go to http://(ip of docker server):8086, you will need to setup your username, password, bucket and organization here. Once that is done navigate to the Data tab, click on Telegraf, and create a configuration for a system. Name it, and copy your API token, you will need this for your Telegraf configuration. You will also need to generate another API token for Grafana. Click on API tokens -> Generate API Token -> Read/Write Access -> Click on your bucket under Read -> and Save. Copy this somewhere as well, you'll need it for Grafana.
Configuring Telegraf
For previous users
If you previously used the pkg install version of telegraf, follow these instructions.
Run sudo pkg remove telegraf to remove telegraf.
Delete the line that starts with telegraf in /usr/local/etc/sudoers.
Once those are done you can continue with the new configuration.
Install the plugin and configure options
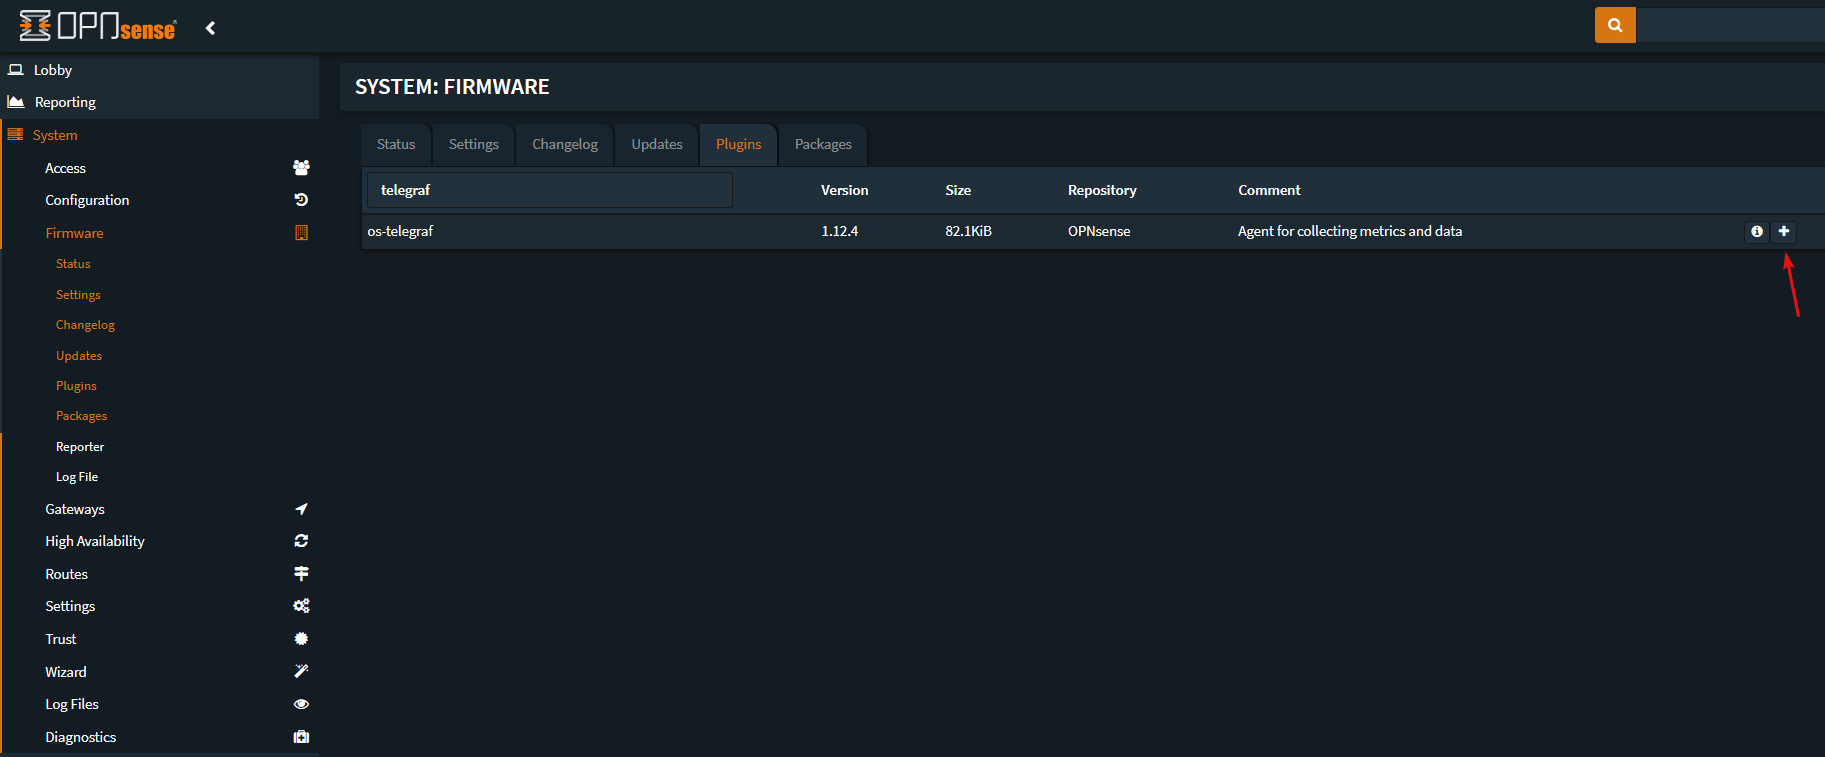
Install the Telegraf plugin on OPNsense, to do so, navigate to System -> Firmware -> Plugins -> Search for telegraf, and click the plus icon to install.
Navigate to Services -> Telegraf -> Input
Enable Network and PF Inputs.
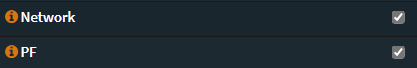
Then click Save.
Now navigate to Services -> Telegraf -> Output
Enable Influx v2 Output and fill in the following:
Influx v2 Token: Your InfluxDB Token
Influx v2 URL: Your InfluxDB URL, this will be the IP address or hostname of your system that is running InfluxDB. E.g http://192.168.1.10:8086
Influx v2 Organization: Your InfluxDB Organization
Influx v2 Bucket: Your InfluxDB Bucket
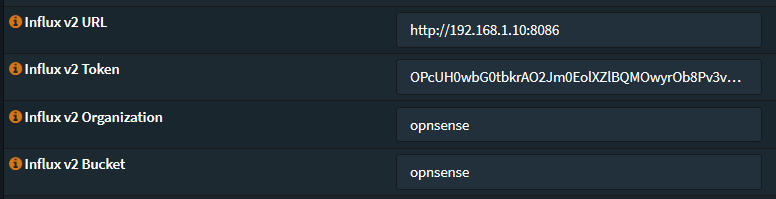
Then click Save.
Alternative OPNSense Configuration via Ansible
You can use Ansible to automate a few sections. Install Ansible on your linux server and use the files at https://github.com/bsmithio/OPNsense-Dashboard/tree/master/ansible. If you use this method you can skip these sections: Add telegraf to sudoers, Telegraf Plugins, and Configuration for the Suricata dashboard.
Add telegraf to sudoers
After that, we need to add telegraf to sudoers and use nopasswd to restrict telegraf to only what it needs to run as root.
1printf 'telegraf ALL=(root) NOPASSWD: /usr/local/bin/telegraf_pfifgw.php\n' | sudo tee -a /usr/local/etc/sudoers > /dev/null
You may also wish to disable sudo logging for telegraf_pfifgw.php, otherwise you'll see many sudo logs from telegraf running the script every 10 seconds.
1printf 'Cmnd_Alias PFIFGW = /usr/local/bin/telegraf_pfifgw.php\n' | sudo tee -a /usr/local/etc/sudoers > /dev/null
2printf 'Defaults!PFIFGW !log_allowed\n' | sudo tee -a /usr/local/etc/sudoers > /dev/null
Add the custom.conf telegraf config to /usr/local/etc/telegraf.d
1sudo mkdir /usr/local/etc/telegraf.d
2sudo chown telegraf:telegraf /usr/local/etc/telegraf.d
3sudo chmod 750 /usr/local/etc/telegraf.d
4sudo curl https://raw.githubusercontent.com/bsmithio/OPNsense-Dashboard/master/config/custom.conf -o /usr/local/etc/telegraf.d/custom.conf
Telegraf Plugins
Plugins must be copied to your OPNsense system
Place telegraf_pfifgw.php and telegraf_temperature.sh in /usr/local/bin and chmod them to 755.
1curl "https://raw.githubusercontent.com/bsmithio/OPNsense-Dashboard/master/plugins/telegraf_pfifgw.php" -o /usr/local/bin/telegraf_pfifgw.php
2curl "https://raw.githubusercontent.com/bsmithio/OPNsense-Dashboard/master/plugins/telegraf_temperature.sh" -o /usr/local/bin/telegraf_temperature.sh
3chmod 755 /usr/local/bin/telegraf_temperature.sh /usr/local/bin/telegraf_pfifgw.php
Test these out before starting the telegraf service by executing them
sudo telegraf_pfifgw.php
telegraf_temperature.sh
The temperature plugin may not work on every system, if you receive sysctl: unknown oid 'hw.acpi.thermal' comment out or remove that line from the plugin.
After this is done, navigate to Services -> Telegraf -> General -> Enable Telegraf Agent.
Lastly, check if Telegraf is running
sudo service telegraf status
Configuring Graylog
Add GeoIP to Graylog
To make the map work on Grafana, you must create a MaxMind account here https://www.maxmind.com/en/geolite2/signup. Then generate a license key by going to Account -> Manage License Keys -> Generate New License Key. Copy this key somewhere because you'll need it again soon.
You'll need to download the GeoIP database file to your Graylog container. Access your Graylog container's shell from your Docker host like so
sudo docker exec -it graylog /bin/bash
Then download the database file, replace YOUR_LICENSE_KEY with the key you generated above.
1curl "https://download.maxmind.com/app/geoip_download?edition_id=GeoLite2-Country&license_key=YOUR_LICENSE_KEY&suffix=tar.gz" -o GeoLite2-Country.tar.gz \
2&& tar -xzvf GeoLite2-Country.tar.gz \
3&& mv GeoLite2-Country_*/GeoLite2-Country.mmdb /usr/share/graylog/data/data/
Configure Additional Settings
In a browser navigate to http://(ip of docker server):9000 and login.
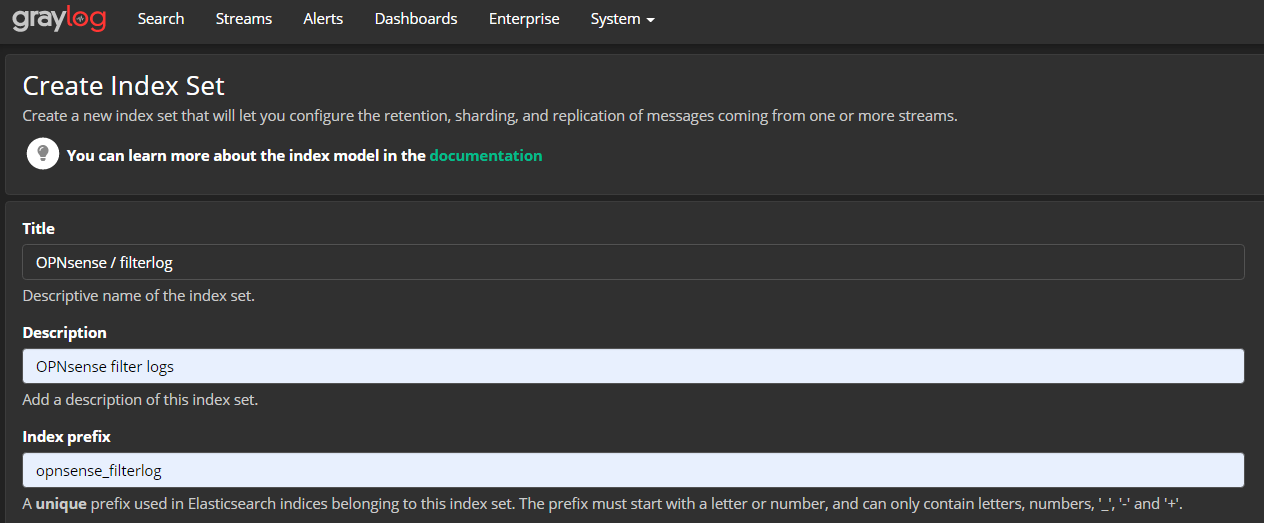
For Graylog, it's recommended to create an index set. To do so, navigate to System -> Indices. Create an index set with the name "OPNsense / filterlog" and set the index prefix to opnsense_filterlog.
Once that's done, download the content pack and install it on Graylog by navigating to System -> Content Packs -> Upload, choose the pack, Upload, then Install.
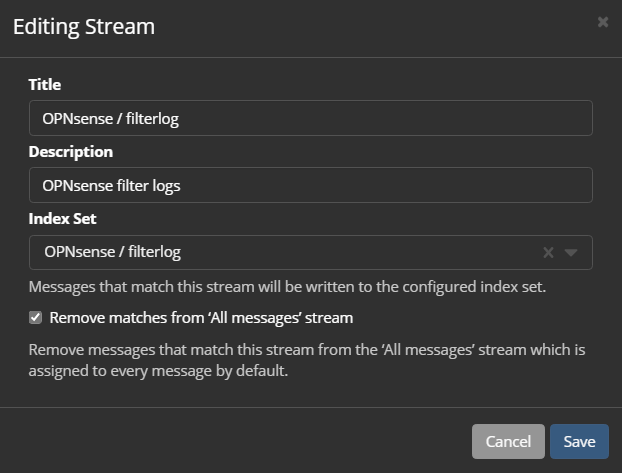
Now, add your index set from earlier to the "OPNsense / filterlog" stream. Navigate to Streams -> More Actions -> Edit Stream -> select your index set and save.
There's one more step we need to do here, navigate to System -> Configurations -> click on Update under Message Processors, and reorder like so:
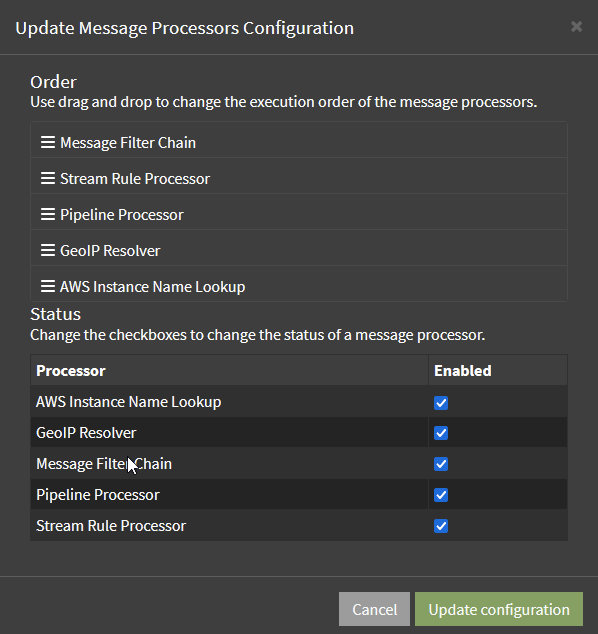
Ensure that all of these are enabled, and click save.
Add Graylog server as syslog target on OPNsense
Once that is all done, login to your OPNsense router and navigate to System -> Settings -> Logging / targets. Add a new target with the following options:
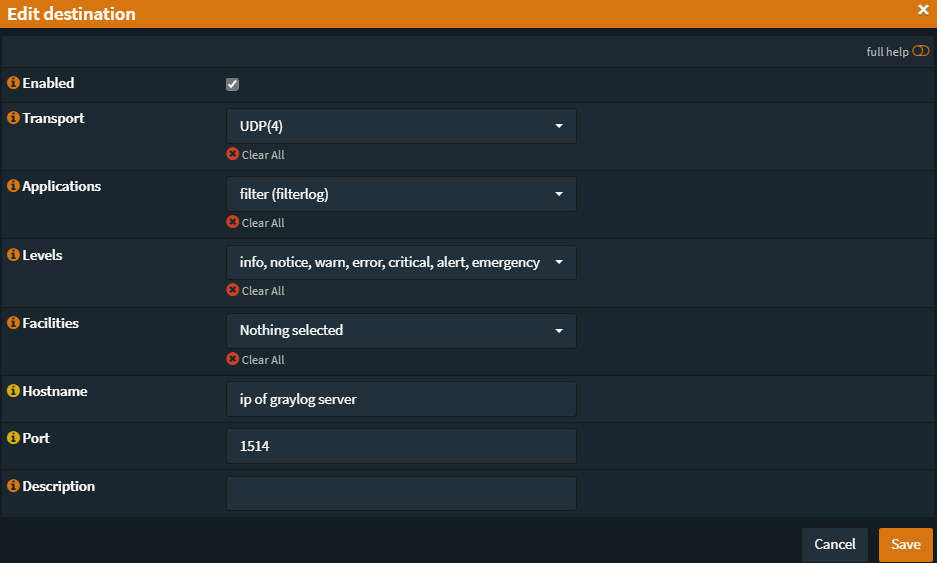
If you are on OPNsense 22.1+ use the following options:
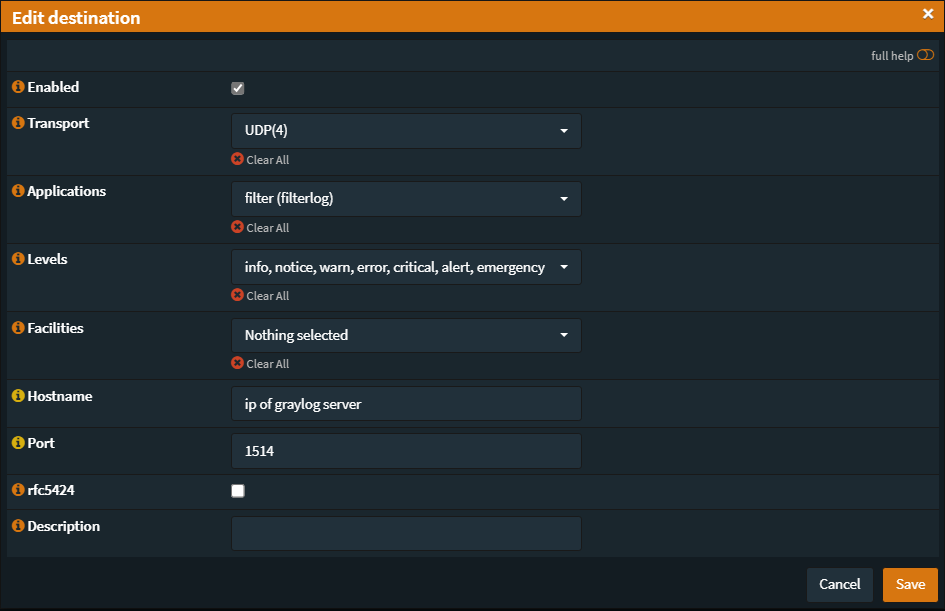
Add a description if you'd like, then click save.
Configuring Grafana
Add InfluxDB and ElasticSearch data sources
You will need to add the data sources on Grafana. Navigate to http://(ip of docker server):3000, login and click on the cog wheel and Add a Data Source.
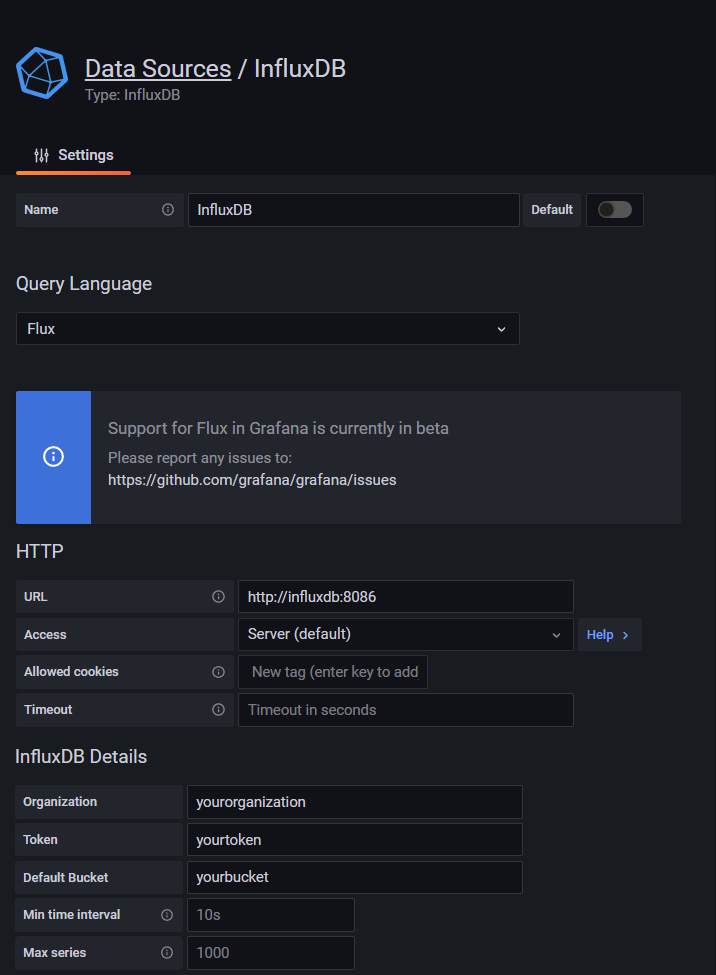
For InfluxDB, make the following configurations
Query Language: Flux
URL: http://influxdb:8086
Organization: Your InfluxDB Organization
Token: Your Grafana InfluxDB API Token
Default Bucket: Your opnsense bucket. This will be the bucket that the panel queries will use.
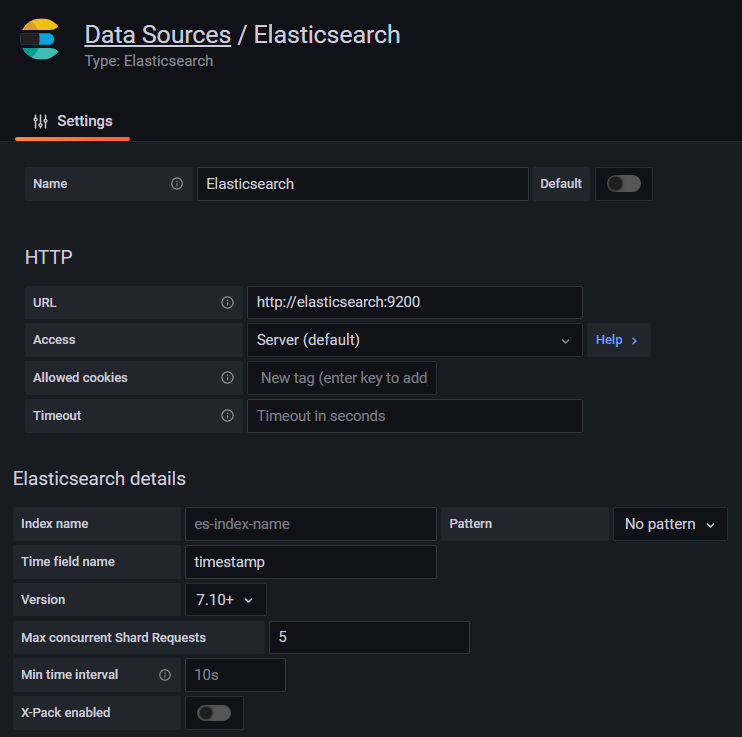
For ElasticSearch, make the following configurations
URL: http://elasticsearch:9200
Time field name: timestamp
Version: 7.10+
Import Dashboard
To import the dashboard, copy the JSON from OPNsense-Grafana-Dashboard.json and navigate to Dashboards -> Browse -> Import and paste under Import via panel json.
Configure Variables
Dashboard Settings -> Variables -> Click on a variable to edit
WAN - $WAN is the variable for our WAN interface panels. It is currently set to igb0 under Custom options. Use a comma-separated list for multiple WAN interfaces.
LAN - $LAN uses a regex to remove any interfaces you don't want to be grouped as LAN. The filtering happens in the "Regex" field. I use a negative lookahead regex to match the interfaces I want excluded. It should be pretty easy to understand what you need to do here. I have excluded igb0 (WAN),igb2,igb3,ovpnc1, and wg0.
iface - $iface is the interface variable for the Firewall panels, I have it set to igb0 by default. You can either remove igb0 so you can select all interfaces, or use a comma separated list of interfaces.
dataSource - dataSource is the variable for our InfluxDB data source. It is the data source that will be used for all panels with InfluxDB queries. You should see a preview of values you can pick from. Under Instance name filter, use the name of the InfluxDB data source you created for OPNsense if you have multiple InfluxDB data sources.
ESdataSource - ESdataSource is the variable four our Elasticsearch data source. It is the data source that will be used for all panels with Elasticsearch queries. You should see a preview of values you can pick from. Under Instance name filter, use the name of the Elastisearch data source you created for OPNsense if you have multiple Elasticsearch data sources.
Lastly, I don't recommend setting the time range beyond 24 hours, due to how many data points that will return in Grafana.
Configuration for the Suricata dashboard #Optional
This section assumes you have already configured Suricata.
Add the necessary files
Add suricata.conf to /usr/local/etc/telegraf.d
1sudo curl 'https://raw.githubusercontent.com/bsmithio/OPNsense-Dashboard/master/config/suricata/suricata.conf' -o /usr/local/etc/telegraf.d/suricata.conf
Add custom.yaml to /usr/local/opnsense/service/templates/OPNsense/IDS
1sudo curl 'https://raw.githubusercontent.com/bsmithio/OPNsense-Dashboard/master/config/suricata/custom.yaml' -o /usr/local/opnsense/service/templates/OPNsense/IDS/custom.yaml
Create the log file and give telegraf permissions to read it
1sudo touch /tmp/eve.json
2sudo chown :telegraf /tmp/eve.json
3sudo chmod 640 /tmp/eve.json
Restart Suricata and Telegraf
Restart Suricata from Services -> Intrusion Detection -> Administration
Uncheck Enabled and click Apply.
Check Enabled and click Apply.
Restart telegraf by running
sudo service telegraf restart
Import the Suricata Dashboard
To import the dashboard, copy the JSON from OPNsense-Grafana-Dashboard-Suricata.json and navigate to Dashboards -> Browse -> Import and paste under Import via panel json.
Troubleshooting
Telegraf Plugins
- You can run most plugins from a shell/ssh session to verify the output. (the environment vars may be different when telegraf is executing the plugin)
- If you're copying from a windows system, make sure the CRLF is correct
- The below command should display unix line endings (\n or LF) as $ and Windows line endings (\r\n or CRLF) as ^M$.
cat -e /usr/local/bin/telegraf_pfifgw.php
Telegraf Troubleshooting
If you get no good output from running the plugin directly, try the following command before moving to the step below.
sudo su -m telegraf -c 'telegraf --test --config /usr/local/etc/telegraf.conf --config-directory /usr/local/etc/telegraf.d'
To troubleshoot plugins further, enable Debug Log and disable Quiet Log in the Telegraf GUI then click Save. Run the above command again.
sudo su -m telegraf -c 'telegraf --test --config /usr/local/etc/telegraf.conf --config-directory /usr/local/etc/telegraf.d'
InfluxDB
When in doubt, run a few queries to see if the data you are looking for is being populated. I recommend doing this in Grafana's Explore tab.
View measurements
import "influxdata/influxdb/schema"

schema.measurements(bucket: "opnsense")
View field values
from(bucket: "opnsense")
  |> range(start: -24h)
  |> filter(fn: (r) => r["_measurement"] == "system")
  |> limit(n:10)
How to drop an InfluxDB v2 measurement
You must access your InfluxDB instance's shell to do this.
To do so run
sudo docker exec -it influxdb /bin/bash
on your docker host.
Then use the following
1influx delete --bucket "$YourBucket" --predicate '_measurement="$Example"' -o $organization --start "1970-01-01T00:00:00Z" --stop "2050-12-31T23:59:00Z" --token "$YourAPIToken"
Learn more about Flux queries
https://docs.influxdata.com/influxdb/cloud/query-data/flux/query-fields/
https://docs.influxdata.com/influxdb/cloud/query-data/flux/explore-schema/
Suricata Troubleshooting
If there is no data on the Suricata dashboard, verify if there are any alerts in /tmp/eve.json.
If there is nothing in /tmp/eve.json, verify that /usr/local/opnsense/service/templates/OPNsense/IDS/custom.yaml and /usr/local/etc/suricata/custom.yaml are identical to the one in this repo.
If /usr/local/etc/suricata/custom.yaml is not identical, but /usr/local/opnsense/service/templates/OPNsense/IDS/custom.yaml is, you will need to reload Suricata from the GUI. To do so you would uncheck Enable in the Suricata GUI, click Apply, then check Enable, and click Apply again. You will need to wait for Suricata to reload. If you have a lot of rules this can take some time.
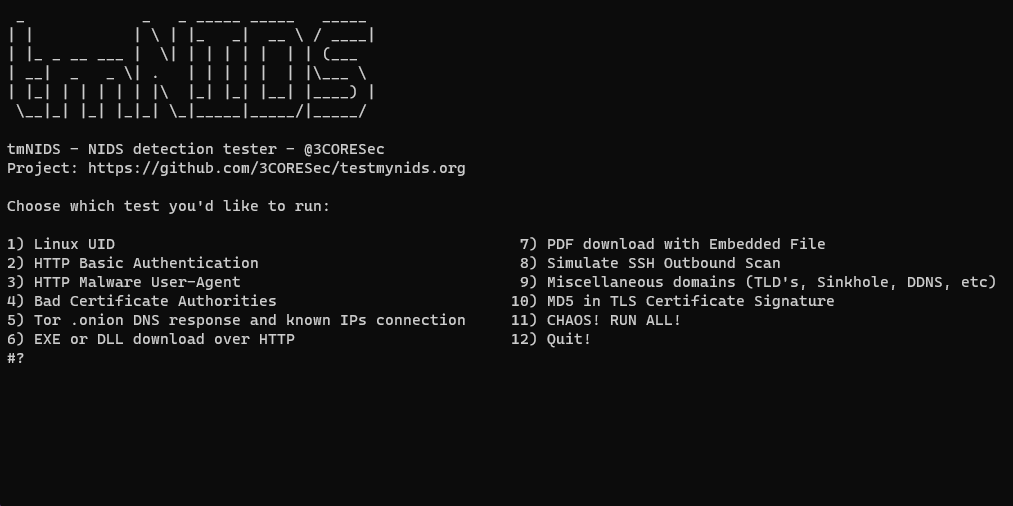
If you've verified and done all the steps above, and still see nothing, you could try using tmNIDS to generate alerts. You will need bash installed on your OPNsense system for this.
sudo pkg install bash
Once you have bash installed, you can use this one-liner to download and execute tmNIDS.
1curl https://raw.githubusercontent.com/3CORESec/testmynids.org/master/tmNIDS -o /tmp/tmNIDS && chmod +x /tmp/tmNIDS && bash /tmp/tmNIDS
You can then run the tests through the CLI.
Map Issues
If you see no GeoIP data on the map make sure you rearranged the Message Processors in System -> Configurations, and reorder like so: